
The time has come to perform some benchmark with Ceph. You expect (or not), they are there, my Ceph’s benchmarks!
I. Storage cluster on commodity hardware
I.1. Assumptions
All the benchmark were performed on RBD, I didn’t performed any benchmarks on CephFS nor RADOSGW.
This article is divided into 3 sections where each section implies a different set of machines or a different configuration. I called them:
- Old commodity servers
- Old commodity servers improved
- Middle-edge servers
- Insane servers
Consideration about the ceph’s journal. The journal is by design the component that could be severely and easily improved. Take a little step back over it. As a reminder the ceph’s journal serves 2 purposes:
- It acts as a buffer cache (FIFO buffer). The journal takes every request and performs each write with O_DIRECT. After a determined period and acknowledgment the journal flush his content to the backend filesystem. By default this value is set to 5 seconds and called
filestore max sync interval. The filestore starts to flush when the journal is half-full or max sync interval is reached. - Failure coverage, pending writes are handled by the Journal if not committed yet to the backend filesystem.
The journal can operate in 2 modes called parallel and writeahead, the given mode is automatically detected according to the file system in use by the OSD backend storage. The parallel mode is only supported by Btrfs.
In practice, common gigabits network can write 100 MB/sec. Let say that you store your journal and your backend storage are stored on the same disk. This disk has a write speed of 100 MB/sec. With the default writeahead mode the write speed will be split after 5 seconds (the default duration during the one the journal starts to flush to the backend filesystem).
The first 5 sec writes at 100 MB/sec, after that writes are splitted like so:
- 50 MB/sec for the journal
- 50 MB/sec for the backend filesystem
At the end the ideal size of the journal if you take in consideration random values like:
- Disk latencies
- Sector to write
- Who knows what :D
More information can be found on the ceph wiki.
I.2. Specifications
I.2.1. Servers
Here the details of my servers:
- Number of servers: 3
- Hardware type: Dell
- Host model: Dell PowerEdge 860
- Host CPU: Intel Xeon CPU 3050 @ 2.13GHz x2
- Host RAM: 4 G
- Host disks: SEAGATE Model: ST3146855SS
- 2x physical RAID 1 of 146GB @ 15K RPM
- Host NIC: Broadcom Corporation NetXtreme BCM5721 Gigabit Ethernet PCI Express
For more information about the disks used.
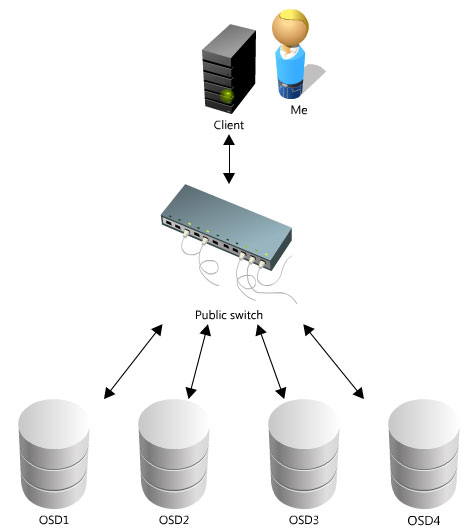
I.2.2. Network
I used one or two private gigabit switches.
Default topology, client writes and OSDs’s replication use the same network link:
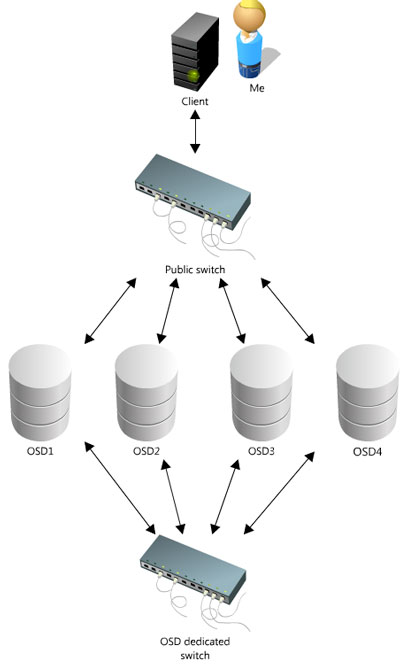
Optimized topology, here the OSD internal replication is handle via the private switch:
I.2.3. Environement specifications
Running softwares and versions:
- Operating system: Ubuntu Server
- Version: LTS 12.04
- LVM:
- 1 tiny LV for the root filesystem (ext4): 20GB
- 1 LV of 100G using XFS
- Ceph version: 0.48 Argonaut
- OSDs numbers: 3
- MON numbers: 3
- Ceph journal:
- first stored on each LV
- Ceph journal size: 2G
My ceph.conf is identical on each node and doesn’t contain any funky options.
II. Environement benchmarks
In order to be sure that we don’t have any bootleneck, I started to bench the cluster environment.
II.1. Local disk benchmarks
Always use the oflag=direct in order to use direct I/O. Why? Because the system maintains a page cache to improve I/O performance. Thanks to this page cache, every single write operations to the storage system are considered completed after the data has been copied to the page cache. The page cache is copied to permanent storage (hard drive disk) using the system call fsync(2).
We definitely want to bypassed those system cache to get ‘real’ performance results.
$ dd if=/dev/zero of=here bs=1G count=1 oflag=direct
1073741824 bytes (1.1 GB) copied, 9.99525 s, 107 MB/s
I got the same result on every servers, since all of them have the same disk model it’s not surprising.
II.2. Evaluate the network
First make sure that the network is not source of any bottleneck. For this purpose we are going to use iperf and the suisse knife army netcat:
II.2.1. Iperf
Iperf will validate the efficient bandwidth between every machines, the real network connection speed. From on server run:
$ iperf -s
------------------------------------------------------------
Server listening on TCP port 5001
TCP window size: 85.3 KByte (default)
------------------------------------------------------------
[  4] local 172.17.1.5 port 5001 connected with 172.17.1.7 port 39815
[ ID] Interval       Transfer     Bandwidth
[  4]  0.0-10.0 sec  1.10 GBytes   941 Mbits/sec
From an another run:
$ iperf -c 172.17.1.5 -i1 -t 10
------------------------------------------------------------
Client connecting to 172.17.1.5, TCP port 5001
TCP window size: 23.5 KByte (default)
------------------------------------------------------------
[  3] local 172.17.1.7 port 39815 connected with 172.17.1.5 port 5001
[ ID] Interval       Transfer     Bandwidth
[  3]  0.0- 1.0 sec   116 MBytes   970 Mbits/sec
[  3]  1.0- 2.0 sec   112 MBytes   944 Mbits/sec
[  3]  2.0- 3.0 sec   111 MBytes   933 Mbits/sec
[  3]  3.0- 4.0 sec   113 MBytes   947 Mbits/sec
[  3]  4.0- 5.0 sec   112 MBytes   935 Mbits/sec
[  3]  5.0- 6.0 sec   113 MBytes   945 Mbits/sec
[  3]  6.0- 7.0 sec   112 MBytes   935 Mbits/sec
[  3]  7.0- 8.0 sec   113 MBytes   946 Mbits/sec
[  3]  8.0- 9.0 sec   111 MBytes   934 Mbits/sec
[  3]  9.0-10.0 sec   113 MBytes   946 Mbits/sec
[  3]  0.0-10.0 sec  1.10 GBytes   943 Mbits/sec
OK.
II.2.2. Netcat
Netcat will determine the current bandwidth for the writes. From on server run:
$ nc -v -v -l -n 2222 >/dev/null
Connection from 172.17.1.8 port 2222 [tcp/*] accepted
From an another machine run:
$ time dd if=/dev/zero | nc -v -v -n 172.17.1.7 2222
Connection to 172.17.1.7 2222 port [tcp/*] succeeded!
^C3991473+0 records in
3991472+0 records out
2043633664 bytes (2.0 GB) copied, 18.1348 s, 113 MB/s

real	0m18.137s
user	0m1.596s
sys	0m15.109s
OK.
With those simples test you can easily found your bottleneck.
III. Ceph benchmarks
R Note that every benchmarks have been preceded by the following command:
$ sudo echo 3 | sudo tee /proc/sys/vm/drop_caches && sudo sync
The bonnie++ test. Since there is no difference between using all the memory available and I reduced this value, I did some tests with a generated size of 8G:
$ sudo bonnie++ -s 8192 -r 4096 -u root -d /mnt/ -m BenchClient
Every RADOS benchmarks with the internal benchmarker have been done like so:
rados bench -p my_pool 300 writerados bench -p my_pool 300 seq
III.1. Rados internal benchmarker
III.1.1. Replica count of 2
** 3 OSDs: Writes**
Total time run:         301.488871
Total writes made:      4200
Write size:             4194304
Bandwidth (MB/sec):     55.723

Stddev Bandwidth:       16.1221
Max bandwidth (MB/sec): 100
Min bandwidth (MB/sec): 0
Average Latency:        1.14695
Stddev Latency:         0.510571
Max latency:            6.16363
Min latency:            0.143685
3 OSDs: Sequential
Total time run:        300.966543
Total reads made:     10528
Read size:            4194304
Bandwidth (MB/sec):    110.551

Average Latency:       0.578213
Max latency:           1.42949
Min latency:           0.085003
5 OSDs: Writes
Bandwidth (MB/sec): 93.003
5 OSDs: Sequential
Bandwidth (MB/sec): 111.165
We reached the bandwidth limitations with the seq.
III.1.2. Replica count of 3
3 OSDs: Writes
Total time run:         301.860407
Total writes made:      4221
Write size:             4194304
Bandwidth (MB/sec):     42.672

Stddev Bandwidth:       11.9161
Max bandwidth (MB/sec): 80
Min bandwidth (MB/sec): 0
Average Latency:        1.49945
Stddev Latency:         0.342719
Max latency:            3.78959
Min latency:            0.399672
3 OSDs: Sequential:
Total time run:        300.620169
Total reads made:     8268
Read size:            4194304
Bandwidth (MB/sec):    110.013

Average Latency:       0.581603
Max latency:           1.43647
Min latency:           0.080254
III.1.3. Does the number of pg influence the performance?
Here I created several pools one by pg num:
- 1000 pg: 41.584 MB/sec
- 2000 pg: 41.884 MB/sec
- 5000 pg: 41.192 MB/sec
- 10000 pg: 41.734 MB/sec
There was absolutly no difference.
III.2. OSDs
This command simulates write from the OSD, which means that you write first on the journal and then to backend file system. As you can see we are very close from my assumptions. My network and my disks can both write to ~110 MB/sec. So the values below are not surprising at all.
$ sudo for j in `seq 10`; do for i in 0 1 2; do ceph osd tell $i bench ; done ; done
ok
ok
...
...
Average values:
osd.0 [INF] bench: wrote 1024 MB in blocks of 4096 KB in 19.109900 sec at 54870 KB/sec
osd.1 [INF] bench: wrote 1024 MB in blocks of 4096 KB in 20.755279 sec at 50520 KB/sec
osd.2 [INF] bench: wrote 1024 MB in blocks of 4096 KB in 19.347267 sec at 54197 KB/sec
III.2.1. RBD mapped devices
The following actions have been done on the client machine:
$ rados mkpool seb
$ rbd -p seb create --size 20000 seb
$ rbd -p seb map seb
$ mkfs.ext4 /dev/rbd0
$ mount /dev/rbd0 /mnt
II.2.1. DDs!
Huge block size:
$ sudo dd if=/dev/zero of=/mnt/lol bs=1G count=1 oflag=direct
1073741824 bytes (1.1 GB) copied, 48.7659 s, 22.0 MB/s
Common block size:
$ sudo dd if=/dev/zero of=/mnt/lal bs=4M count=1000 oflag=direct
4194304000 bytes (4.2 GB) copied, 231.526 s, 18.1 MB/s
II.2.2. Bonnie++
Bonnie++
Version  1.96       ------Sequential Output------ --Sequential Input- --Random-
Concurrency   1     -Per Chr- --Block-- -Rewrite- -Per Chr- --Block-- --Seeks--
Machine        Size K/sec %CP K/sec %CP K/sec %CP K/sec %CP K/sec %CP  /sec %CP
compute02    32088M   494  96 21599   2 10136   1  2345  95 45398   3 252.7  15
Latency             16171us    4590ms    1573ms   38982us     193ms     201ms
Version  1.96       ------Sequential Create------ --------Random Create--------
compute02           -Create-- --Read--- -Delete-- -Create-- --Read--- -Delete--
              files  /sec %CP  /sec %CP  /sec %CP  /sec %CP  /sec %CP  /sec %CP
                 16 11940  22 +++++ +++ 22407  32 13639  24 +++++ +++  9377  13
Latency               406us     579us    1042us     448us      15us     701us
1.96,1.96,compute02,1,1344551648,32088M,,494,96,21599,2,10136,1,2345,95,45398,3,252.7,15,16,,,,,11940,22,+++++,+++,22407,32,13639,24,+++++,+++,9377,13,16171us,4590ms,1573ms,38982us,193ms,201ms,406us,579us,1042us,448us,15us,701us
With the option: filestore flusher set to false
Version  1.96       ------Sequential Output------ --Sequential Input- --Random-
Concurrency   1     -Per Chr- --Block-- -Rewrite- -Per Chr- --Block-- --Seeks--
Machine        Size K/sec %CP K/sec %CP K/sec %CP K/sec %CP K/sec %CP  /sec %CP
Control01        8G   510  97 28455   4 30642   3  2436  95 2728545  99 696.1  21
Latency             15920us    1910ms    3485ms    3206us      61us    7308us
Version  1.96       ------Sequential Create------ --------Random Create--------
Control01           -Create-- --Read--- -Delete-- -Create-- --Read--- -Delete--
              files  /sec %CP  /sec %CP  /sec %CP  /sec %CP  /sec %CP  /sec %CP
                 16 23726  46 +++++ +++ 32471  53 26351  50 +++++ +++ 23727  39
Latency               700us     568us     741us     494us      13us     720us
1.96,1.96,Control01,1,1345196347,8G,,510,97,28455,4,30642,3,2436,95,2728545,99,696.1,21,16,,,,,23726,46,+++++,+++,32471,53,26351,50,+++++,+++,23727,39,15920us,1910ms,3485ms,3206us,61us,7308us,700us,568us,741us,494us,13us,720us
---
Commodity improved!
The first improvement that you can bring to your cluster is definitely to store your journal in a dedicated disk, ideally a SSD. Here with used a Dell SSD.
I. Rados
I.1. Rados write
3 OSDs
Total time run:         304.745479
Total writes made:      4661
Write size:             4194304
Bandwidth (MB/sec):     61.179

Stddev Bandwidth:       38.3555
Max bandwidth (MB/sec): 120
Min bandwidth (MB/sec): 0
Average Latency:        1.04608
Stddev Latency:         1.25134
Max latency:            10.747
Min latency:            0.158048
4 OSDs
Total time run:         309.768170
Total writes made:      4897
Write size:             4194304
Bandwidth (MB/sec):     63.234

Stddev Bandwidth:       44.439
Max bandwidth (MB/sec): 132
Min bandwidth (MB/sec): 0
Average Latency:        1.01208
Stddev Latency:         1.57929
Max latency:            12.227
Min latency:            0.133978
5 OSDs
Total time run:         300.712355
Total writes made:      6366
Write size:             4194304
Bandwidth (MB/sec):     84.679

Stddev Bandwidth:       39.9759
Max bandwidth (MB/sec): 144
Min bandwidth (MB/sec): 0
Average Latency:        0.755717
Stddev Latency:         0.893649
Max latency:            10.881
Min latency:            0.137202
I.2. Rados seq
The seq tests reached the Gigabits limit for a while, only the Write matter. This is why I only performed 2 tests, one with 3 OSDs and the other with 5 OSDs.
Total time run:        207.287149
Total reads made:     5656
Read size:            4194304
Bandwidth (MB/sec):    109.143

Average Latency:       0.586076
Max latency:           1.76351
Min latency:           0.074353
5 OSDs:
Total time run:        110.200887
Total reads made:     3042
Read size:            4194304
Bandwidth (MB/sec):    110.417

Average Latency:       0.579155
Max latency:           1.75389
Min latency:           0.048253
II. OSD
$ sudo for j in `seq 10`;do for i in 0 1 2; do ceph osd tell $i bench ; done; done
ok
ok
...
...
Average values:
osd.0 [INF] bench: wrote 1024 MB in blocks of 4096 KB in 9.154749 sec at 111 MB/sec
osd.1 [INF] bench: wrote 1024 MB in blocks of 4096 KB in 9.136084 sec at 112 MB/sec
osd.2 [INF] bench: wrote 1024 MB in blocks of 4096 KB in 6.674849 sec at 153 MB/sec
III. RBD
III.1. DD
Huge block size:
$ dd if=/dev/zero of=/mnt/lol bs=1G count=1 oflag=direct
1073741824 bytes (1.1 GB) copied, 35.4976 s, 30.2 MB/s
With the option: filestore flusher set to false
$ dd if=/dev/zero of=/mnt/lol bs=1G count=1 oflag=direct
1073741824 bytes (1.1 GB) copied, 17.4976 s, 60.2 MB/s
Common block size:
$ dd if=/dev/zero of=/mnt/count bs=4M count=1000 oflag=direct
4194304000 bytes (4.2 GB) copied, 94.2111 s, 44.5 MB/s
III.2. Bonnie++
Version  1.96       ------Sequential Output------ --Sequential Input- --Random-
Concurrency   1     -Per Chr- --Block-- -Rewrite- -Per Chr- --Block-- --Seeks--
Machine        Size K/sec %CP K/sec %CP K/sec %CP K/sec %CP K/sec %CP  /sec %CP
Compute01        8G   495  98 24954   3 24548   2  2234  99 2710065  99 682.2  21
Latency             16428us    3108ms    5602ms    3889us     139us    7167us
Version  1.96       ------Sequential Create------ --------Random Create--------
Compute01           -Create-- --Read--- -Delete-- -Create-- --Read--- -Delete--
              files  /sec %CP  /sec %CP  /sec %CP  /sec %CP  /sec %CP  /sec %CP
                 16 26153  46 +++++ +++ +++++ +++ 32226  54 +++++ +++ +++++ +++
Latency               649us     566us     715us     469us      15us     710us
1.96,1.96,Compute01,1,1344845207,8G,,495,98,24954,3,24548,2,2234,99,2710065,99,682.2,21,16,,,,,26153,46,+++++,+++,+++++,+++,32226,54,+++++,+++,+++++,+++,16428us,3108ms,5602ms,3889us,139us,7167us,649us,566us,715us,469us,15us,710us
With the option: filestore flusher set to false
Version  1.96       ------Sequential Output------ --Sequential Input- --Random-
Concurrency   1     -Per Chr- --Block-- -Rewrite- -Per Chr- --Block-- --Seeks--
Machine        Size K/sec %CP K/sec %CP K/sec %CP K/sec %CP K/sec %CP  /sec %CP
Control01        8G   518  98 41844   5 45389   5  2559  99 2726799  99  3254  98
Latency             50820us     659ms   10272ms    3220us     326us   10390us
Version  1.96       ------Sequential Create------ --------Random Create--------
Control01           -Create-- --Read--- -Delete-- -Create-- --Read--- -Delete--
              files  /sec %CP  /sec %CP  /sec %CP  /sec %CP  /sec %CP  /sec %CP
                 16  7614  15 +++++ +++ +++++ +++ 30888  60 +++++ +++ +++++ +++
Latency               715us     554us     842us     481us      12us     716us
1.96,1.96,Control01,1,1345157006,8G,,518,98,41844,5,45389,5,2559,99,2726799,99,3254,98,16,,,,,7614,15,+++++,+++,+++++,+++,30888,60,+++++,+++,+++++,+++,50820us,659ms,10272ms,3220us,326us,10390us,715us,554us,842us,481us,12us,716us
With the option: filestore flusher set to false and 4 OSDs:
Version  1.96       ------Sequential Output------ --Sequential Input- --Random-
Concurrency   1     -Per Chr- --Block-- -Rewrite- -Per Chr- --Block-- --Seeks--
Machine        Size K/sec %CP K/sec %CP K/sec %CP K/sec %CP K/sec %CP  /sec %CP
Control01        8G   509  98 49789   6 50924   6  2582  99 2738115 100  3012  93
Latency             15995us    1713ms   13267ms    3191us      41us    9365us
Version  1.96       ------Sequential Create------ --------Random Create--------
Control01           -Create-- --Read--- -Delete-- -Create-- --Read--- -Delete--
              files  /sec %CP  /sec %CP  /sec %CP  /sec %CP  /sec %CP  /sec %CP
                 16 14593  28 +++++ +++ +++++ +++ +++++ +++ +++++ +++ +++++ +++
Latency               730us     568us     753us     499us      13us     795us
1.96,1.96,Control01,1,1345203449,8G,,509,98,49789,6,50924,6,2582,99,2738115,100,3012,93,16,,,,,14593,28,+++++,+++,+++++,+++,+++++,+++,+++++,+++,+++++,+++,15995us,1713ms,13267ms,3191us,41us,9365us,730us,568us,753us,499us,13us,795us
With the option: filestore flusher set to false and 5 OSDs:
Version  1.96       ------Sequential Output------ --Sequential Input- --Random-
Concurrency   1     -Per Chr- --Block-- -Rewrite- -Per Chr- --Block-- --Seeks--
Machine        Size K/sec %CP K/sec %CP K/sec %CP K/sec %CP K/sec %CP  /sec %CP
Control01        8G   489  99 58579   8 61046   7  2554  99 2736782  99  3283 102
Latency             16889us     971ms    5086ms    3238us      53us   10256us
Version  1.96       ------Sequential Create------ --------Random Create--------
Control01           -Create-- --Read--- -Delete-- -Create-- --Read--- -Delete--
              files  /sec %CP  /sec %CP  /sec %CP  /sec %CP  /sec %CP  /sec %CP
                 16 27475  55 +++++ +++ 21142  34 +++++ +++ +++++ +++ +++++ +++
Latency               670us     558us     730us     470us      12us     722us
1.96,1.96,Control01,1,1345202370,8G,,489,99,58579,8,61046,7,2554,99,2736782,99,3283,102,16,,,,,27475,55,+++++,+++,21142,34,+++++,+++,+++++,+++,+++++,+++,16889us,971ms,5086ms,3238us,53us,10256us,670us,558us,730us,470us,12us,722us
---
Middle-edge servers!
I.2. SPECIFICATIONS
I.2.1. SERVERS
Here the details of my servers:
- Number of servers: 2
- Hardware type: Dell
- Host model: Dell PowerEdge R520
- Host CPU: Intel Xeon CPU E5-2403 @ 1.80GHz x8
- Host RAM: 32 G
- Host disks: 4x RAID 1 of 600GB SAS 15K RPM
I.2.2. ENVIRONEMENT SPECIFICATIONS
Running softwares and versions:
- Operating system: Ubuntu Server
- Version: LTS 12.04
- Ceph version: 0.48 Argonaut
- OSDs numbers: 6; 3 per server
- MON numbers: 1
- Ceph journal: stored on 1 SSD on each server
- Ceph journal size: 2G
II. ENVIRONEMENT BENCHMARKS
In order to be sure that we don’t have any bootleneck, I started to bench the cluster environment.
II.1. LOCAL DISK BENCHMARKS
Huge block size:
$ dd if=/dev/zero of=seb bs=1G count=1 oflag=direct
1073741824 bytes (1.1 GB) copied, 4.76773 s, 225 MB/s
Common block size:
$ dd if=/dev/zero of=seb bs=4M count=250 oflag=direct
1048576000 bytes (1.0 GB) copied, 3.97997 s, 263 MB/s
III. Ceph benchmarks
III.1. RADOS internal benchmarker
Here I seeked the maximum performance, so I used a client bonded links with Round-robin in order to overcome the Gigabit limit.
Write
Total time run:         300.518826
Total writes made:      10584
Write size:             4194304
Bandwidth (MB/sec):     140.876

Stddev Bandwidth:       13.5806
Max bandwidth (MB/sec): 184
Min bandwidth (MB/sec): 72
Average Latency:        0.454281
Stddev Latency:         0.214257
Max latency:            1.622
Min latency:            0.106254
Sequential
Total time run:        297.490987
Total reads made:     10584
Read size:            4194304
Bandwidth (MB/sec):    142.310

Average Latency:       0.44962
Max latency:           2.03957
Min latency:           0.054391
III.2. OSDS
OSD internal writes:
osd.5 [INF] bench: wrote 1024 MB in blocks of 4096 KB in 1.573642 sec at 650 MB/sec
osd.1 [INF] bench: wrote 1024 MB in blocks of 4096 KB in 2.070818 sec at 494 MB/sec
osd.3 [INF] bench: wrote 1024 MB in blocks of 4096 KB in 1.593774 sec at 642 MB/sec
osd.2 [INF] bench: wrote 1024 MB in blocks of 4096 KB in 2.027097 sec at 505 MB/sec
osd.4 [INF] bench: wrote 1024 MB in blocks of 4096 KB in 1.632214 sec at 627 MB/sec
osd.0 [INF] bench: wrote 1024 MB in blocks of 4096 KB in 2.082020 sec at 491 MB/sec
III.3. RBD
III.3.1. DDs
Huge block size:
$ dd if=/dev/zero of=/mnt/lol bs=1G count=1 oflag=direct
1073741824 bytes (1.1 GB) copied, 7.66643 s, 140 MB/s
Common block size:
$ dd if=/dev/zero of=/mnt/lol bs=4M count=250 oflag=direct
1048576000 bytes (1.0 GB) copied, 11.3414 s, 92.5 MB/s
III.3.2. Bonnie++
Bonnie++:
Version  1.96       ------Sequential Output------ --Sequential Input- --Random-
Concurrency   1     -Per Chr- --Block-- -Rewrite- -Per Chr- --Block-- --Seeks--
Machine        Size K/sec %CP K/sec %CP K/sec %CP K/sec %CP K/sec %CP  /sec %CP
BenchClient      8G   900  98 87434   8 144289  11  3032  99 7704813  99  4202  96
Latency             19407us   20065us     168us    3957us     139us      73us
Version  1.96       ------Sequential Create------ --------Random Create--------
BenchClient         -Create-- --Read--- -Delete-- -Create-- --Read--- -Delete--
              files  /sec %CP  /sec %CP  /sec %CP  /sec %CP  /sec %CP  /sec %CP
                 16 +++++ +++ +++++ +++ +++++ +++ +++++ +++ +++++ +++ +++++ +++
Latency               316us     788us     854us     348us      16us     378us
1.96,1.96,BenchClient,1,1345571416,8G,,900,98,87434,8,144289,11,3032,99,7704813,99,4202,96,16,,,,,+++++,+++,+++++,+++,+++++,+++,+++++,+++,+++++,+++,+++++,+++,19407us,20065us,168us,3957us,139us,73us,316us,788us,854us,348us,16us,378us
---
Insane servers!

I. Specifications
I.1. Servers
Here the details of my servers:
- Hardware type: Dell
- Host model: Dell PowerEdge R620
- Host CPU: Intel Xeon CPU E5-2660 0 @ 2.20GHz x32
- Host RAM: 65 G
- Host disks: SSD DELL
- 2x RAID 1 of 100G
- 2x RAID 1 of 200G
I.2. ENVIRONEMENT SPECIFICATIONS
Running softwares and versions:
- Operating system: Ubuntu Server
- Version: LTS 12.04
- Ceph version: 0.48 Argonaut
- OSDs numbers: 3
- MON numbers: 3
- Ceph journal: stored on 1 SSD on each server
- Ceph journal size: 2G
II. ENVIRONEMENT BENCHMARKS
In order to be sure that we don’t have any bootleneck, I started to bench the cluster environment.
II.1. LOCAL DISK BENCHMARKS
R Note about the SSDs. The first hit, hits the SSD internal buffer so you get amazing performance. Below the first hit (the buffer) and the second one (and so on).
Huge block size:
$ dd if=/dev/zero of=seb bs=1G count=1 oflag=direct
1073741824 bytes (1.1 GB) copied, 3.72137 s, 289 MB/s
1073741824 bytes (1.1 GB) copied, 6.79279 s, 158 MB/s
Common block size:
$ dd if=/dev/zero of=seb bs=4M count=250 oflag=direct
1048576000 bytes (1.0 GB) copied, 2.89631 s, 362 MB/s
1048576000 bytes (1.0 GB) copied, 7.32222 s, 143 MB/s
III. Ceph benchmarks
III.1. RADOS INTERNAL BENCHMARKER
Write
Total time run:         300.562480
Total writes made:      6575
Write size:             4194304
Bandwidth (MB/sec):     87.503

Stddev Bandwidth:       5.31243
Max bandwidth (MB/sec): 100
Min bandwidth (MB/sec): 60
Average Latency:        0.731271
Stddev Latency:         0.464997
Max latency:            1.80529
Min latency:            0.15539
With a dedicated private network:
Total time run:         300.994975
Total writes made:      8306
Write size:             4194304
Bandwidth (MB/sec):     110.381

Stddev Bandwidth:       23.0465
Max bandwidth (MB/sec): 156
Min bandwidth (MB/sec): 56
Average Latency:        0.579727
Stddev Latency:         0.338156
Max latency:            1.88386
Min latency:            0.120633
With a dedicated private network and round-robin bonded clients:
Total time run:         300.330944
Total writes made:      11338
Write size:             4194304
Bandwidth (MB/sec):     151.007

Stddev Bandwidth:       28.6038
Max bandwidth (MB/sec): 204
Min bandwidth (MB/sec): 64
Average Latency:        0.423753
Stddev Latency:         0.207152
Max latency:            1.30265
Min latency:            0.117577
Sequential
Total time run:        234.377939
Total reads made:     6575
Read size:            4194304
Bandwidth (MB/sec):    112.212

Average Latency:       0.57021
Max latency:           1.40867
Min latency:           0.0825
With a dedicated private network:
Total time run:        296.067941
Total reads made:     8306
Read size:            4194304
Bandwidth (MB/sec):    112.217

Average Latency:       0.570205
Max latency:           1.61435
Min latency:           0.085098
With a dedicated private network and round-robin bonded clients:
Total time run:        255.446166
Total reads made:     11338
Read size:            4194304
Bandwidth (MB/sec):    177.540

Average Latency:       0.360375
Max latency:           1.07688
Min latency:           0.056551
III.2. OSDS
OSD internal writes:
osd.0 [INF] bench: wrote 1024 MB in blocks of 4096 KB in 4.937443 sec at 207 MB/sec
osd.1 [INF] bench: wrote 1024 MB in blocks of 4096 KB in 4.847808 sec at 211 MB/sec
osd.2 [INF] bench: wrote 1024 MB in blocks of 4096 KB in 4.937443 sec at 207 MB/sec
III. RBD
III.1. DDS
Huge block size:
$ sudo dd if=/dev/zero of=/mnt/bench bs=1G count=1 oflag=direct
1073741824 bytes (1.1 GB) copied, 11.8962 s, 90.3 MB/s
Common block size:
$ sudo dd if=/dev/zero of=/mnt/lal bs=4M count=1000 oflag=direct
4194304000 bytes (4.2 GB) copied, 47.0956 s, 89.1 MB/s
With a dedicated private network
$ sudo dd if=/dev/zero of=/mnt/bench bs=1G count=1 oflag=direct
1073741824 bytes (1.1 GB) copied, 10.358 s, 104 MB/s
With a dedicated private network and round-robin bonded clients:
$ sudo dd if=/dev/zero of=/mnt/bench bs=1G count=1 oflag=direct
1073741824 bytes (1.1 GB) copied, 6.8115 s, 158 MB/s
III.2. bonnie++
Version  1.96       ------Sequential Output------ --Sequential Input- --Random-
Concurrency   1     -Per Chr- --Block-- -Rewrite- -Per Chr- --Block-- --Seeks--
Machine        Size K/sec %CP K/sec %CP K/sec %CP K/sec %CP K/sec %CP  /sec %CP
BenchClient      8G   884  97 67352   6 91087   7  3183  99 7721231  99  4339 104
Latency             19237us    2171us     160us    3768us     141us     110us
Version  1.96       ------Sequential Create------ --------Random Create--------
BenchClient         -Create-- --Read--- -Delete-- -Create-- --Read--- -Delete--
              files  /sec %CP  /sec %CP  /sec %CP  /sec %CP  /sec %CP  /sec %CP
                 16 +++++ +++ +++++ +++ +++++ +++ +++++ +++ +++++ +++ +++++ +++
Latency              1317us     818us     869us     288us      15us     526us
1.96,1.96,BenchClient,1,1344648723,8G,,884,97,67352,6,91087,7,3183,99,7721231,99,4339,104,16,,,,,+++++,+++,+++++,+++,+++++,+++,+++++,+++,+++++,+++,+++++,+++,19237us,2171us,160us,3768us,141us,110us,1317us,818us,869us,288us,15us,526us
With a dedicated private network and round-robin bonded clients:
Version  1.96       ------Sequential Output------ --Sequential Input- --Random-
Concurrency   1     -Per Chr- --Block-- -Rewrite- -Per Chr- --Block-- --Seeks--
Machine        Size K/sec %CP K/sec %CP K/sec %CP K/sec %CP K/sec %CP  /sec %CP
BenchClient      8G   888  98 76432   8 148261  11  3371  99 7720435 100  4450 106
Latency             19265us     361ms     154us    3664us     131us      66us
Version  1.96       ------Sequential Create------ --------Random Create--------
BenchClient         -Create-- --Read--- -Delete-- -Create-- --Read--- -Delete--
              files  /sec %CP  /sec %CP  /sec %CP  /sec %CP  /sec %CP  /sec %CP
                 16 +++++ +++ +++++ +++ +++++ +++ +++++ +++ +++++ +++ +++++ +++
Latency              1273us     795us     849us     285us      15us     374us
1.96,1.96,BenchClient,1,1345068839,8G,,888,98,76432,8,148261,11,3371,99,7720435,100,4450,106,16,,,,,+++++,+++,+++++,+++,+++++,+++,+++++,+++,+++++,+++,+++++,+++,19265us,361ms,154us,3664us,131us,66us,1273us,795us,849us,285us,15us,374us
Some final thoughts:
- As many OSDs you have as better is the load-balance in the cluster. Let’s assume that you use 1 disk per OSD, it means that you will prefer 2 disk of 500G instead of 1T disk.
- The usage of a SSD dramatically improves your OSD’s performance
- Replica count of 2 brings more performance than a replica count of 3, but it’s less secure
- Using a dedicated private network for the internal OSDs replication really improve the performance
- It’s really easy with decent hardware to overcome the 1G bandwidth limitation
- Setting the
filestore flusheroption to false can radically improve your performance, mainly on old system - Even if more pg means better load-balance, setting a large number of pg doesn’t enhance your performance
This benchmarking session with Ceph was really exciting since it forced me to dive into Ceph’s meanders. According to my result, it was pretty easy to touch the limitation of a 1G network, even with several optimizations like round-robin bounding. I will be happy to work with 10G switches when those onces will be affordable, with this constat we are far away from the ‘commodity hardware’ statement.